Affichage valeurs sur un ggplot

Postez ici vos questions, réponses, commentaires ou suggestions - Les sujets seront ultérieurement répartis dans les archives par les modérateurs

Modérateur : Groupe des modérateurs

Mathilde DEMONCHY
Messages : 20
Enregistré le : 26 Juin 2019, 07:15

Affichage valeurs sur un ggplot

Messagepar Mathilde DEMONCHY » 21 Jan 2020, 13:18

Bonjour,

Je réalise un boxplot avec ggplot, et je rajoute des valeurs calculées (les quantiles: médiane, q1 et q3).
J'utilise geom_text et hjust pour décaler mes valeurs sur la droite ou la gauche de mes boxplots.
Mon problème est que les valeurs ne se mettent pas sur un axe vertical, du coup ce n'est pas présentable.

Merci de m'aider si vous avez une solution.

mon graphe :
https://si3.photorapide.com/invites/photos/2020/01/21lfiv.png
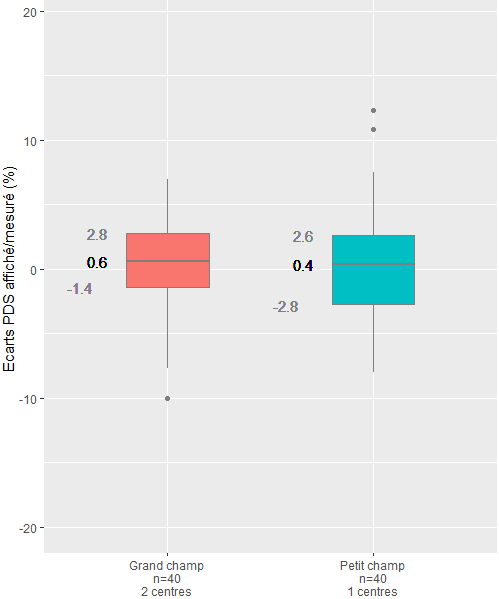
Voici mon code :

Code : Tout sélectionner

# Charger
library(ggplot2)
library(tidyverse) # pour les fonctions fct_reorder / stringr
library(plyr) # pour la fonction dplyr


# création du dataframe
Num_etablissement <- rep ( c(1,2,3,2),10)
Champ <- rep ( c("Grand champ","Petit champ"),40)
Ecart_PDS_chp <-rnorm(40, mean=1, sd= 6)
df1 <- data.frame(Num_etablissement,Champ, Ecart_PDS_chp)

# création du dataframe modifié et calcul des quantiles
annot_data <- df1 %>%   
  group_by(Champ) %>%
  dplyr::mutate(n = n(), centres = n_distinct(Num_etablissement) , q1=round(quantile(Ecart_PDS_chp, 0.25),1),
q3=round(quantile(Ecart_PDS_chp, 0.75),1),
med=round(median(Ecart_PDS_chp, na.rm=TRUE),1)  ) %>%
  ungroup() %>%
mutate(x_label = paste0(Champ, "\nn=", n, "\n", centres,  " centres"  ))

# création du graphique
g1 <- ggplot(annot_data , aes( x = x_label, y = Ecart_PDS_chp, fill=Champ)) +
geom_boxplot(colour="grey50", width=0.4) +
xlab("")+ylab("Ecarts PDS affiché/mesuré (%)")+
coord_cartesian ( ylim= c(-20,20))+
geom_text(data=annot_data, aes(x=x_label, y=med, label = med),  hjust=4)+
geom_text(data=annot_data, aes(x=x_label, y=q1, label = q1), hjust=4, colour="grey50")+
geom_text(data=annot_data, aes(x=x_label, y=q3, label = q3), hjust=4, colour="grey50")

g1


Bonne journée
Matou

Guillaume Devailly
Messages : 28
Enregistré le : 22 Déc 2017, 12:31

Re: Affichage valeurs sur un ggplot

Messagepar Guillaume Devailly » 21 Jan 2020, 14:41

Bonjour,

essayez plutôt de laisser hjust à 1 et de décaler vers la gauche les nombres avec nudge_x :

Code : Tout sélectionner

g1 <- ggplot(annot_data , aes( x = x_label, y = Ecart_PDS_chp, fill=Champ)) +
     geom_boxplot(colour="grey50", width=0.4) +
     xlab("")+ylab("Ecarts PDS affiché/mesuré (%)")+
     coord_cartesian ( ylim= c(-20,20))+
     geom_text(data=annot_data, aes(x=x_label, y=med, label = med),  hjust=1, nudge_x = -0.25)+
     geom_text(data=annot_data, aes(x=x_label, y=q1, label = q1), hjust=1, nudge_x = -0.25, colour="grey50")+
     geom_text(data=annot_data, aes(x=x_label, y=q3, label = q3), hjust=1, nudge_x = -0.25, colour="grey50")

Serge Rapenne
Messages : 1426
Enregistré le : 20 Aoû 2007, 15:17
Contact :

Re: Affichage valeurs sur un ggplot

Messagepar Serge Rapenne » 21 Jan 2020, 14:46

Bonjour,

j'utilise peu ggplot2 mais il me semble que hjust doit être compris entre 0 et 1. 0 pour justifié à gauche, .5 pour centrer et 1 pour justifié à droite.
Pour déplacer le texte, il faut utiliser la fonction nudge_x .
Avec ton exemple, je ferais comme ça :

Code : Tout sélectionner

g1 <- ggplot(annot_data , aes( x = x_label, y = Ecart_PDS_chp, fill=Champ)) +
    geom_boxplot(colour="grey50", width=0.4) +
    xlab("")+ylab("Ecarts PDS affiché/mesuré (%)")+
    coord_cartesian ( ylim= c(-20,20))+
    geom_text(data=annot_data, aes(x=x_label, y=med, label = med),nudge_x = -0.25, hjust=0.5)+
    geom_text(data=annot_data, aes(x=x_label, y=q1, label = q1), nudge_x = -0.25,hjust=0.5, colour="grey50")+
    geom_text(data=annot_data, aes(x=x_label, y=q3, label = q3), nudge_x = -0.25,hjust=0.5, colour="grey50")

g1


Serge

Mathilde DEMONCHY
Messages : 20
Enregistré le : 26 Juin 2019, 07:15

Re: Affichage valeurs sur un ggplot

Messagepar Mathilde DEMONCHY » 21 Jan 2020, 15:09

Merci ! ça fonctionne parfaitement
c'est exactement ce qu'il me fallait, je ne connaissais pas nudge_x :-)

Bonne fin de journée à tous
Matou


Retourner vers « Questions en cours »

Qui est en ligne

Utilisateurs parcourant ce forum : Aucun utilisateur enregistré et 1 invité